GDOES
The glow discharge spectrometry GDOES offers the possibility to analyze both the layer thickness and the composition.
Quantitative GDOES depth profile analyzes offer the possibility of analyzing layers with a thickness of a few atomic layers up to a depth of 500 µm and more through concentration depth profile courses. Due to our very good equipment (we have 2 new glow discharge spectrometers GDA750 HR from Spectruma Analytik GmbH) and our more than 25 years of experience, we analyze your layers quickly and reliably.
We differed from our competitors in the depth profile analysis of your samples as follows:
- Every layer or every sample is analyzed by us with ideal excitation conditions and optimized analysis gases.
- We can analyze the smallest samples using pulsed high-frequency analysis with a lateral resolution of up to 0.8 mm.
- We always analyze the thinnest / most complex layers to be analyzed in parallel using REM/EDX or XRF to ensure a complete and correct analysis.
- Quantitative GDOES depth profile analyzes are part of our accreditation according to DIN EN ISO 17025.
- On request, we can determine the measurement uncertainty of our results according to currently valid standards (GUM, EURCHEM).
- All glow discharge spectrometers and spark spectrometers are checked annually with a calibration certificate.
- We can distinguish organic from inorganic carbon on the sample surface.
- Through pulsed high-frequency analysis, we achieve very good depth resolution, even with thermally unstable layers/substrates.
- We can perform a stoichiometrically correct determination of oxide layers.
- With us, an H determination is possible with “only minor” artefacts in your layers.
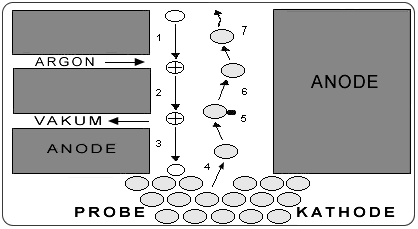
The technical basis of the metal and surface analysis methods is a gas discharge lamp as a sputtering and excitation source, in which the sample is sputtered off almost plane-parallel by argon ions. The sputtering process and the excitation take place as shown in Figure 1:
 Source: SPEKTRUMA Analytik GmbH
Excitation mechanism in plasma
Argon particles are ionized by applying a DC voltage (1) and are accelerated (2,3) due to the potential difference onto the sample, which is connected as a cathode. As a result, sample particles are sputtered off and v. a. excited (6) by electron impact (5). The emitted light quanta are analyzed in an optical emission spectrometer (7).
 Source: SPEKTRUMA Analytik GmbH
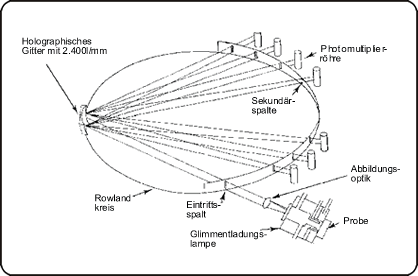
Structure of the optical emission spectrometer
The area of the ablation depends on the selected anode diameter, which is usually 4 or 2.5 mm.
The light quanta are imaged through a lens onto a holographic grid (Figure 2). The wavelengths are separated using an optical arrangement according to Paschen/Runge on a Rowland circle. It is thus possible to measure the characteristic spectral lines of all elements at the same time. If the measurement is also carried out in a time-resolved manner using a computer system, the changes in concentration of all elements present along the depth axis can be recorded through a layer [3,4].
Based on the development work of A. Bengtson and his co-workers, it is now possible to transform time-resolved GDO(E)S intensity curves into concentration-depth profiles using a multi-matrix calibration. Such a calibration takes into account the fact that different materials have different sputtering rates. The concentrations of the elements in an unknown sample are obtained by normalizing the element content to 100%. The depth is determined by comparing the current sputtering rate with the sputtering rate of pure iron [2,4].
Advantages of quantitative GDOS depth profile analysis:
- Depth profile analysis of round and curved samples is possible!
- Determination of all elements (incl. H) possible
- Low detection limits (0.1 – 50 ppm; exception Cl and F)
- High sputter rateà depth profile analysis down to 100 µm
- Inexpensive purchase, low analysis costs compared to other surface analysis methods
- Chemical analysis of the base material possible + reproducibility < 1% rsd + depth resolution: approx. 10% of the removed depth (depending on the surface roughness)
Disadvantages of quantitative GDOS depth profile analysis:
- Lateral resolution >2 mm
- Availability of calibration standards
- Binding states only detectable to a limited extent
In principle, the detection limits of optical emission spectrometers or glow discharge spectrometers can be determined using the following two options:
- Determination of the repeatability of the spectral background
- Determination of BEC/30
On 1. By determining the spectral background, the detection limit of the individual elements can be determined relatively quickly and easily. In practice, a sample containing the analyte in a significantly lower concentration than the detection limit for this element is z. B. measured 10 times. The absolute standard deviation * 3 is by definition the detection limit of this element. This only works if the
Standard deviation is mainly determined by the spectral background and the analyte is not present or is only present in a very low concentration.
Since the modern, high-resolution spark and glow discharge spectrometers sometimes have detection limits in the lower ppm range, such ultrapure samples are either not available or only available to a very limited extent.
To 2. Assuming a linear calibration curve in the trace range, the BEC value can be determined by a 2-point calibration in the trace range. Assuming a relative repeatability of 1%, the detection limit can be determined with BEC/30. The determination limit and detection limit, which are then important for the analysis, can also be derived from the detection limit.
The general rule:
- Only above the limit of detection (LOD) statements can be made as to whether an element is present in a sample with a certain probability or not. It is not possible to give information about the concentration of the element in a sample.
- The limit of detection is equal to twice the limit of detection. The detection limit indicates the minimum content of a corresponding sample that can be detected with sufficient certainty.
- The limit of quantification or limit of quantification (LOQ) is the smallest concentration of an analyte that can be determined quantitatively with a specified precision. Quantitative analysis results are only given above the limit of quantification.
Caution: For daily practice, both in spark spectrometry OES and in glow discharge spectrometry GDOES, it is important to be able to make quantitative statements about element concentrations only above the limit of quantification.
ISO: “Surface chemical analysis – determination of thickness and chemical composition of zinc-based metallic coatings by glow discharge optical emission spectromerty” ;04/1999 » read «
(pdf file, Size 247 KB)
A. Bengtson: “Quantitative depth profile analysis by glow discharge”;GB 1994 » read «
(pdf file, Size 476 KB)
T. Asam: Schnelle Tiefenprofilanalytik mit der Glimmentladungsspektroskopie ; VDI-Seminar “Angewandte Oberflächen-,Grenzflächen- und Dünnschichtanalytik”; May 2000 » read «
(pdf file, Size 1,37 Mb)
Herr Dr. W. Verscharen: U,I-Abhängigkeit der Sputtergeschwindgkeit ; November 2002 » read «
Veröffentlichungen:
Prüfung von Randschichten – Übersicht
This file is available as a PowerPoint presentation (Size: 4,64 Mb unpacked)
» download « as zip file (Größe: 4,19 Mb)
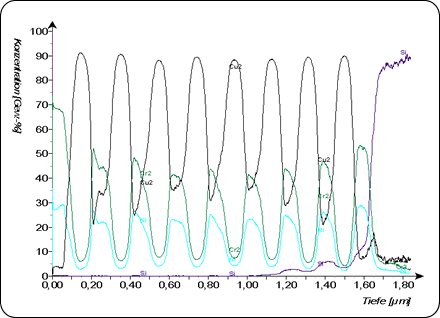
The depth resolution is a decisive criterion for all sputtering analysis methods. It is often claimed that the GDOS can no longer properly resolve “thin” layers. The example below shows the analysis of 10 alternating Cu and Cr/Ni layers with a total thickness of 1.6 microns.
All layers can be resolved comparatively well. Notable is V. a. that the underlying layers cannot be resolved any less poorly than layers on the surface of the sample.
 60 nm mit 3 nm / Schicht
 Quelle: Spectruma Analytik GmbH
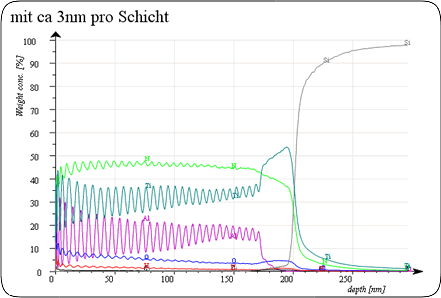
The depth resolution of very thin layers such as the TiN/TiAlN/…TiAlN/TiNH/Si layers shown here with a layer thickness of approx. 3 nm per layer clearly shows the individual layers with the impurities between the layers (elements H and O).
 Quelle: Spectruma Analytik GmbH
Conversion of the intensity-time profiles into concentration-depth profiles as follows (information without formulas):
1. Performing a calibration with certified samples with a known sputter rate (sputter rate correction)
2. Calculation of the concentrations of all essential elements of each volume segment
3. Normalization to 100%
4. Calculation of density
5. Calculation of the thickness of each volume segment
7. Adding all volume segments
Text missing
Practical examples
Gas nitrated piston
Pistons made of the material 42CrMo4 were gas-nitrided with a specification for the thickness of the compound layer of 10 + 10 µm. Pistons from the current batches could only form a compound layer of 8 – 10 µm without changing the furnace parameters.
Metallographic micrographs did not show any causes for the insufficient connection layers.
A quantitative GDOES depth profile analysis of a piston revealed a compound layer thickness of 9.5 µm.
However, an extreme accumulation of sulfur at a depth of 1 µm was noticeable.
Due to a production bottleneck, the cutting speed was doubled, which caused passive layers to form on the surface due to the coolant. This led to a diffusion of sulfur into the surface of the component with the associated formation of a passive layer.
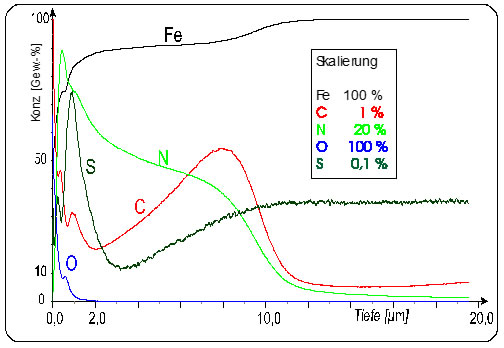
Salt bath nitrided samples
3 Samples were salt bath nitrocarburized as follows:
– Inconel-Tiegel + NS2 Bad
– Titan-Tiegel + NS2 Bad
– Titan –Tiegel + TF1 Bad
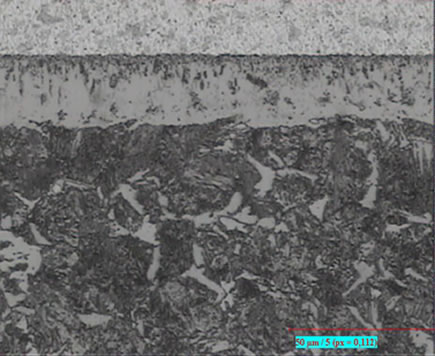
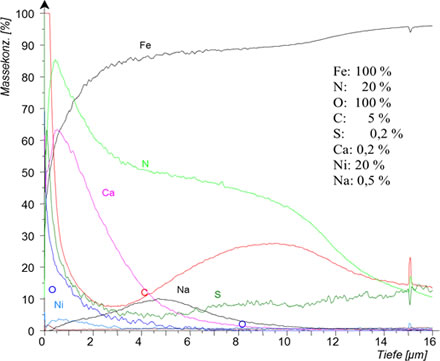
All 3 samples were metallographically prepared and evaluated. In addition, samples were analyzed by quantitative GDOES depth profile analysis.
Inconel-Tiegel + NS2 Bad
Titan-Tiegel + NS2 Bad
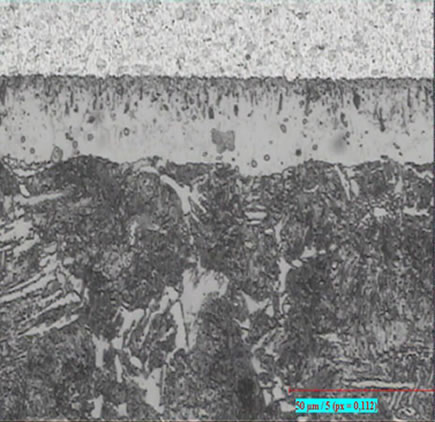
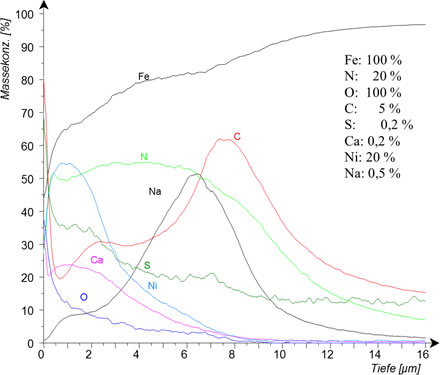
Titan –Tiegel + TF1 Bad
Text fehlt
Text fehlt
Text fehlt
Text fehlt
Text fehlt
Text fehlt
Text fehlt
Text fehlt
Text fehlt
Text fehlt
Text fehlt
A radio frequency source is required for depth profiling analysis of non-conductive layers. A quantification of the intensity-time profiles is possible by calibrating with reference samples.
Pulsed discharges can be used in order not to damage the sample surface due to the sometimes high energy input during the sputtering process. This leads to significantly improved depth resolution by choosing the optimal excitation conditions.
Semiconductor layer with GaN intermediate layer
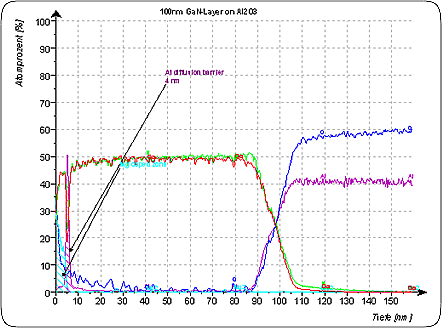
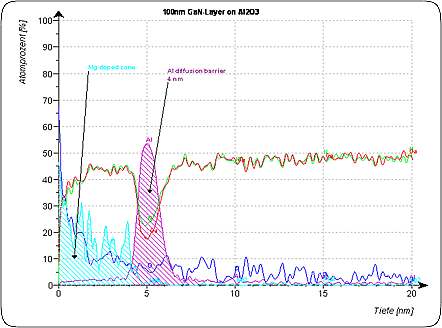
On the surface of a 100 nm thick semiconductor layer consisting of GaN there is a Mg enrichment of approx. 250 ppm. A diffusion barrier consisting of Al with a layer thickness of 4 nm can be seen underneath.
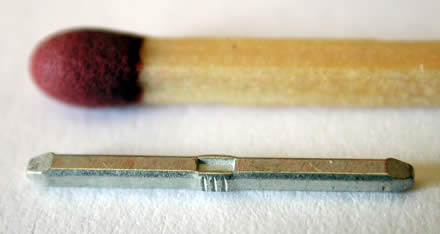
Adapter for wires in the universal measuring chamber
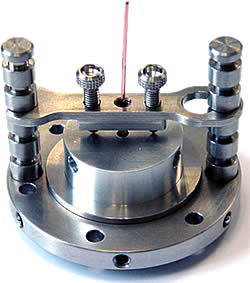
- Easy sample change
- Defined sample preparation
- Different sample diameters possible
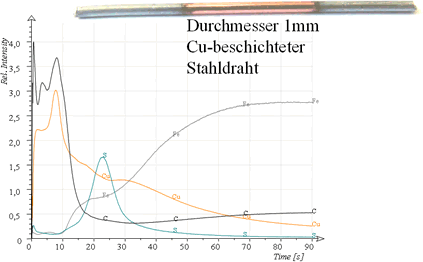
Cu-coated steel wire
