


Fracture assessment (SEM/EDX)
TAZ GmbH works with two scanning electron microscopes (SEM) with connected energy-dispersive X-ray microanalysis systems (EDX).
Since the introduction of such devices in the 1960s, they have become an indispensable instrument in material analysis. They represent the ultimate addition to the analysis methods otherwise used, such as emission spectroscopy, glow discharge and metallographic investigations.
The basic functions are based on the interactions of accelerated and focused electrons with the sample material to be examined.
With the scanning electron microscope (SEM), the surface of an object/a material sample is scanned in a line with a focused electron beam. The entire process takes place in a high vacuum to avoid interactions with atoms and molecules in the air. Depending on the surface topography and material composition of a sample, different numbers of backscattered or secondary electrons are generated. These signals, which arise at each raster point, are displayed synchronously on a screen as different brightness values. The images have a high resolution and a high depth of field. The magnification to be achieved, usually 20 to 50,000 times, results from the ratio of the scanned area to the size of the screen.
The X-ray microanalysis system (EDX) connected to the SEM uses another interaction of the electron beam with the sample material, the generation of X-rays. These are picked up by a detector and displayed with a multi-channel analyzer as a spectrum of intensity versus energy. The specific energy of the X-rays is determined by the excited atoms and is therefore characteristic of the elements in question. The measured intensities provide information on the concentration of the elements present. This method is thus z. B. the analysis of the smallest particles possible.
Since all signals from the devices are detected simultaneously, spatially resolved distribution images, so-called mappings, are possible. This can e.g. For example, the distribution of contaminants over a specific area of the sample surface can be visualized.
- Examination of the topography of material surfaces for processing structures, wear, contamination, deposits and corrosion attack
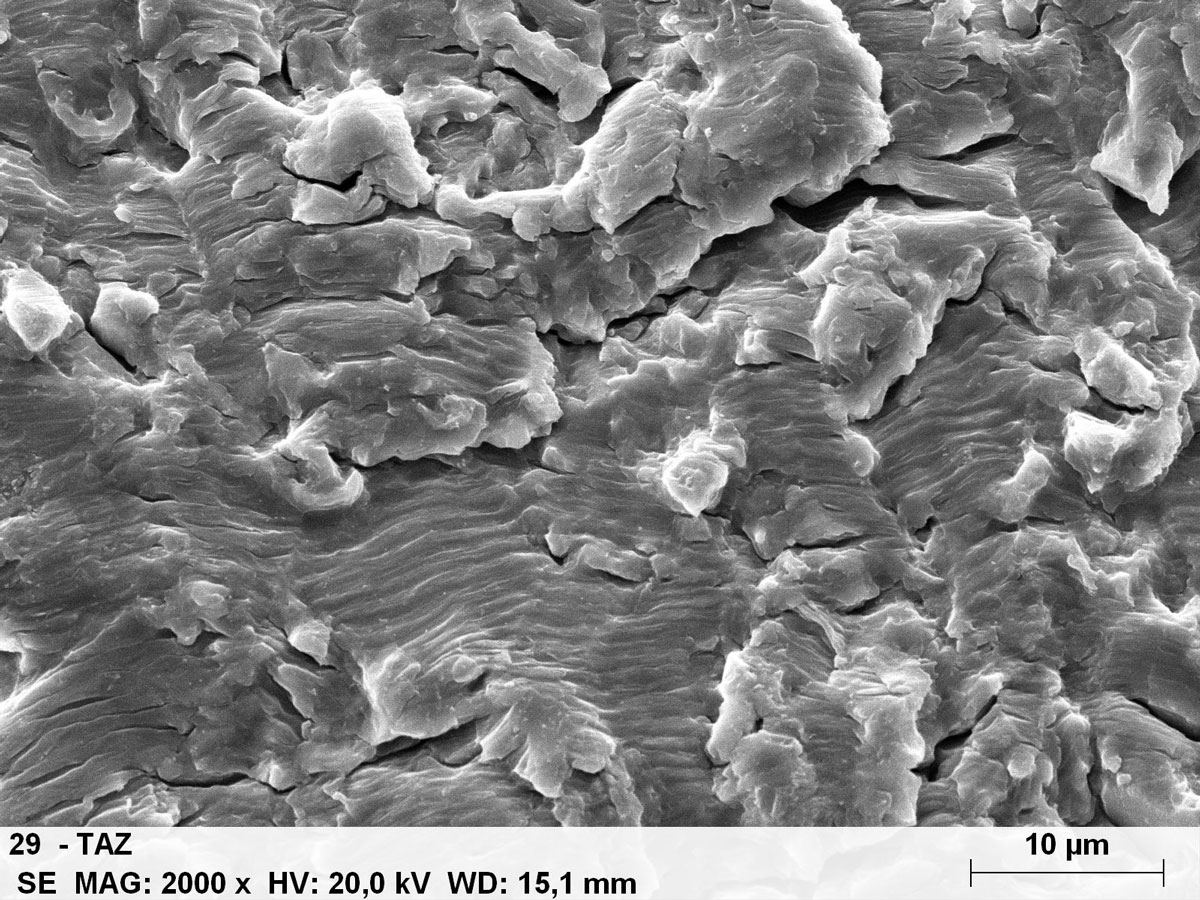
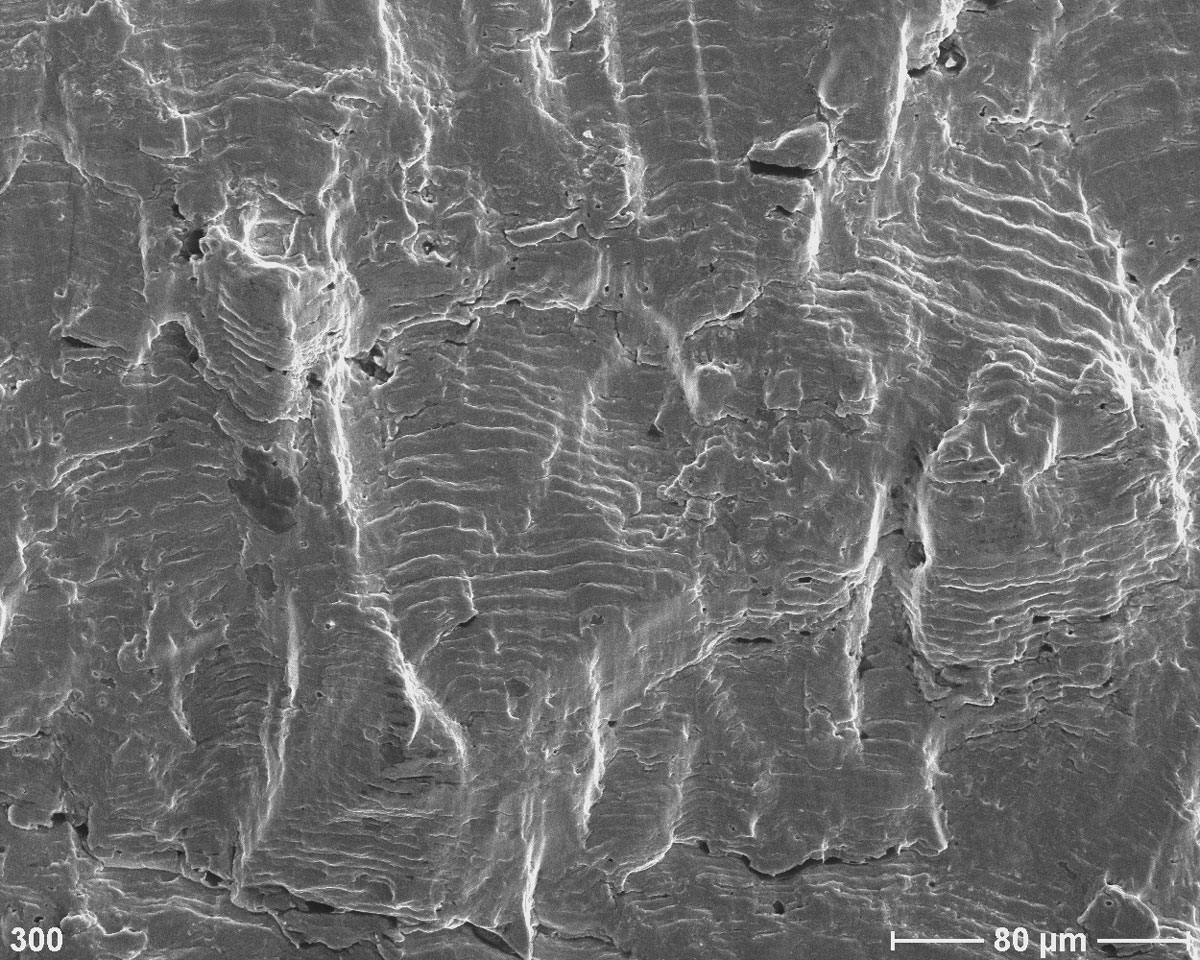
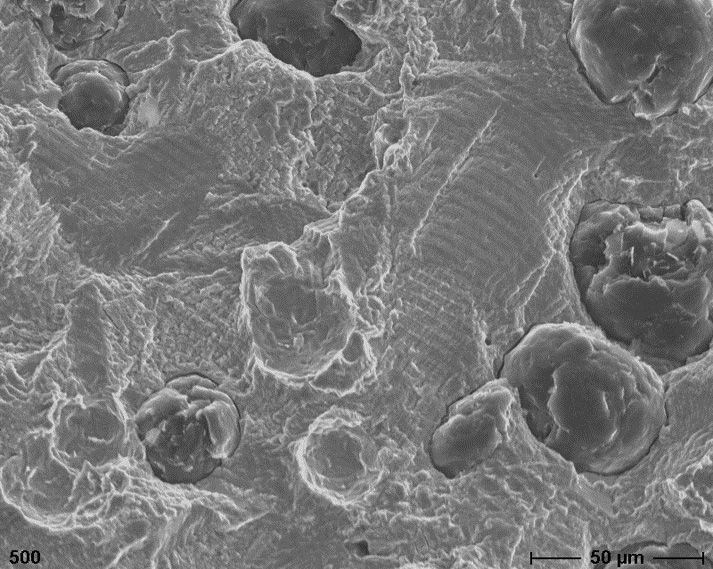
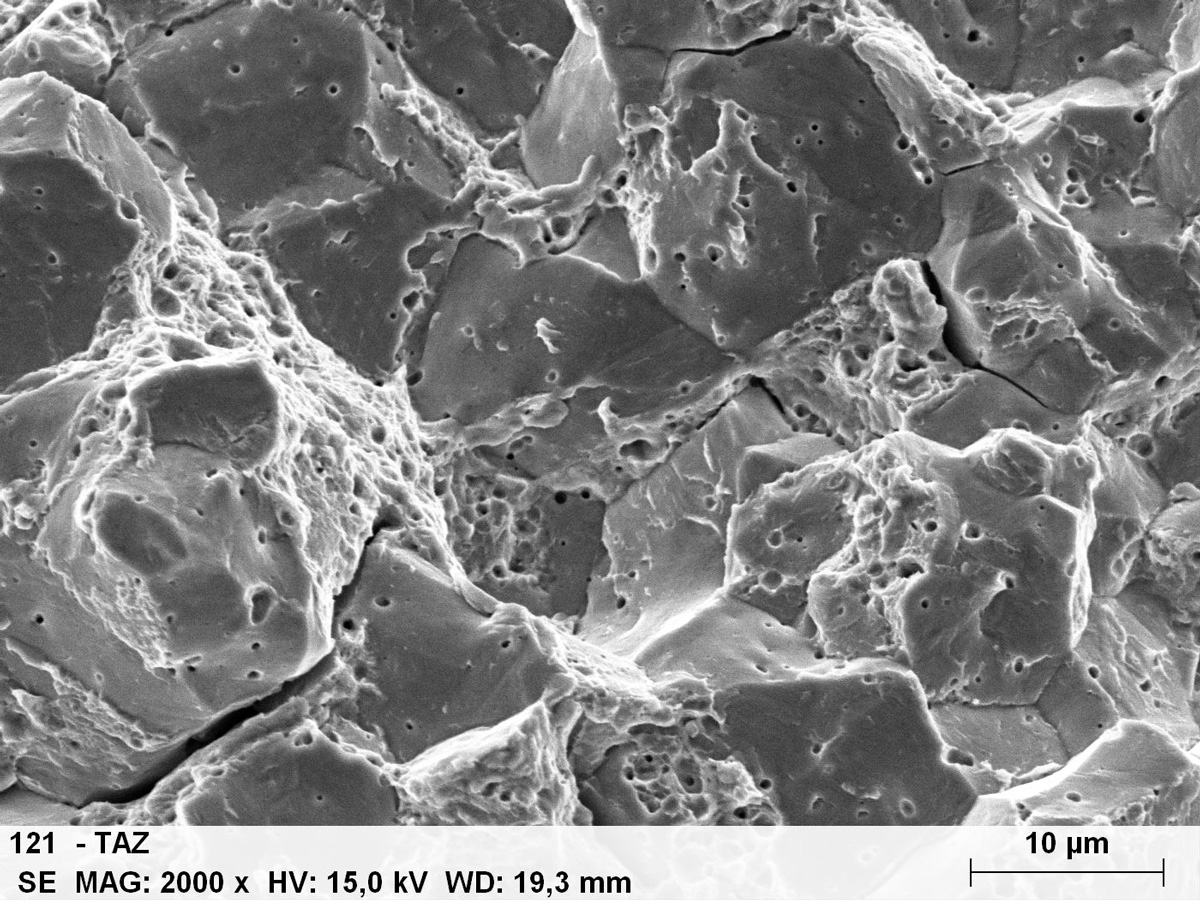
structure of fracture surfaces - Detection of material defects such as inclusions, oxide skins, doubling
- Analysis of particles, inclusions and precipitates
- Structure and analysis of coatings, measurement of layer thicknesses
- Analysis of surfaces and associated element distribution images
- and much more
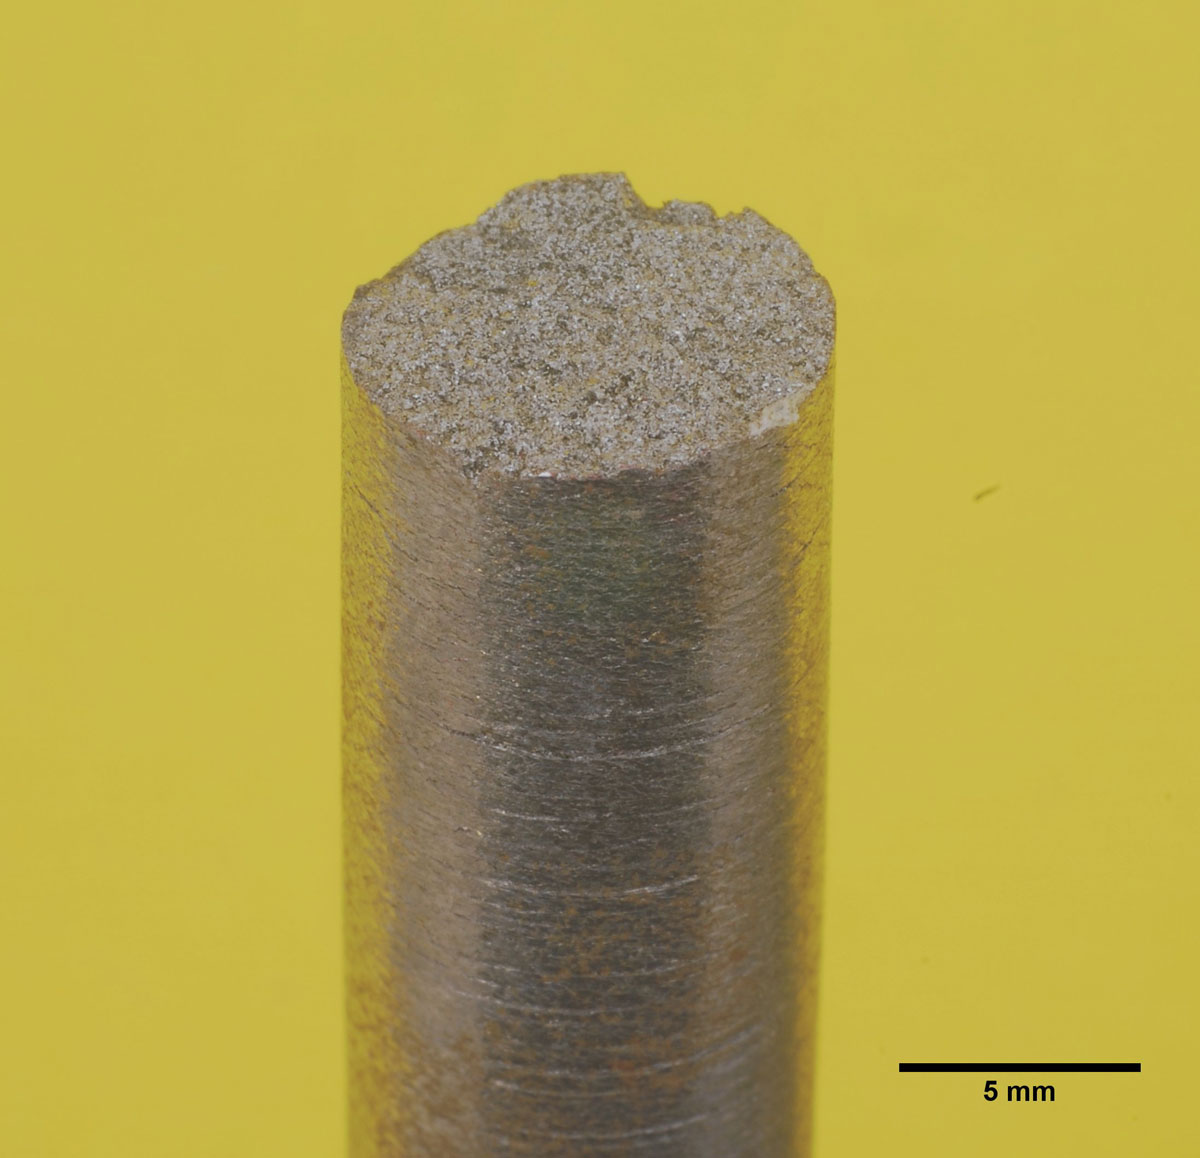
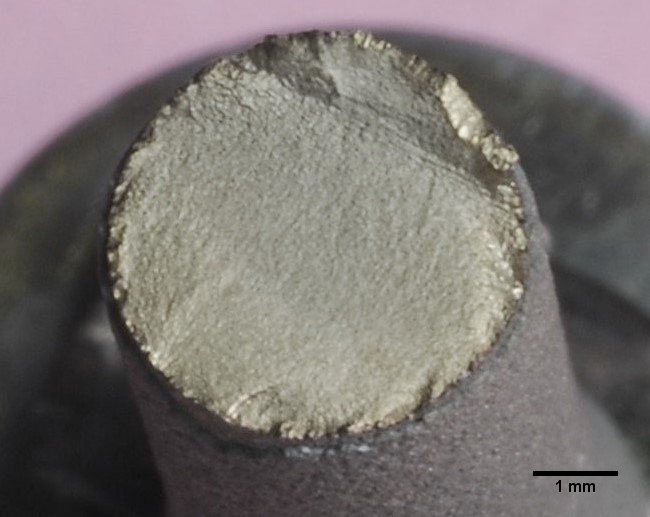
Examples and pictures:
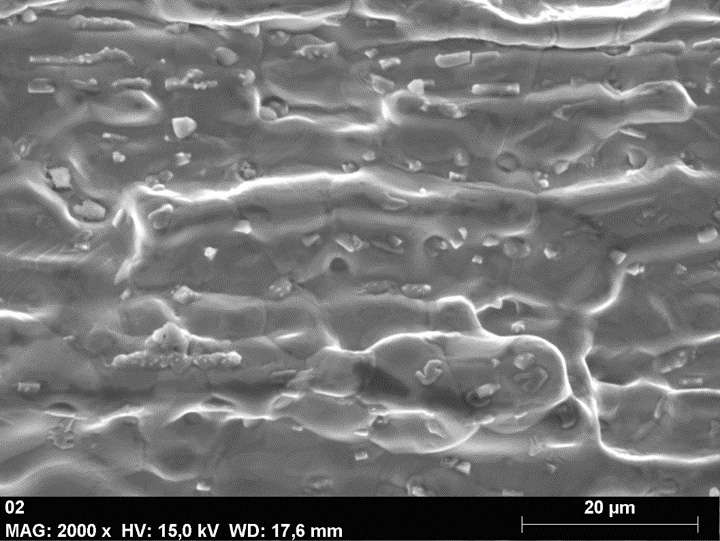
In the examples below, some breaks from practice are shown.
Fractions can be classified according to a wide variety of criteria:
A – Simplest classification according to visible or invisible plastic deformation in
Ductile fracture

Brittle fracture
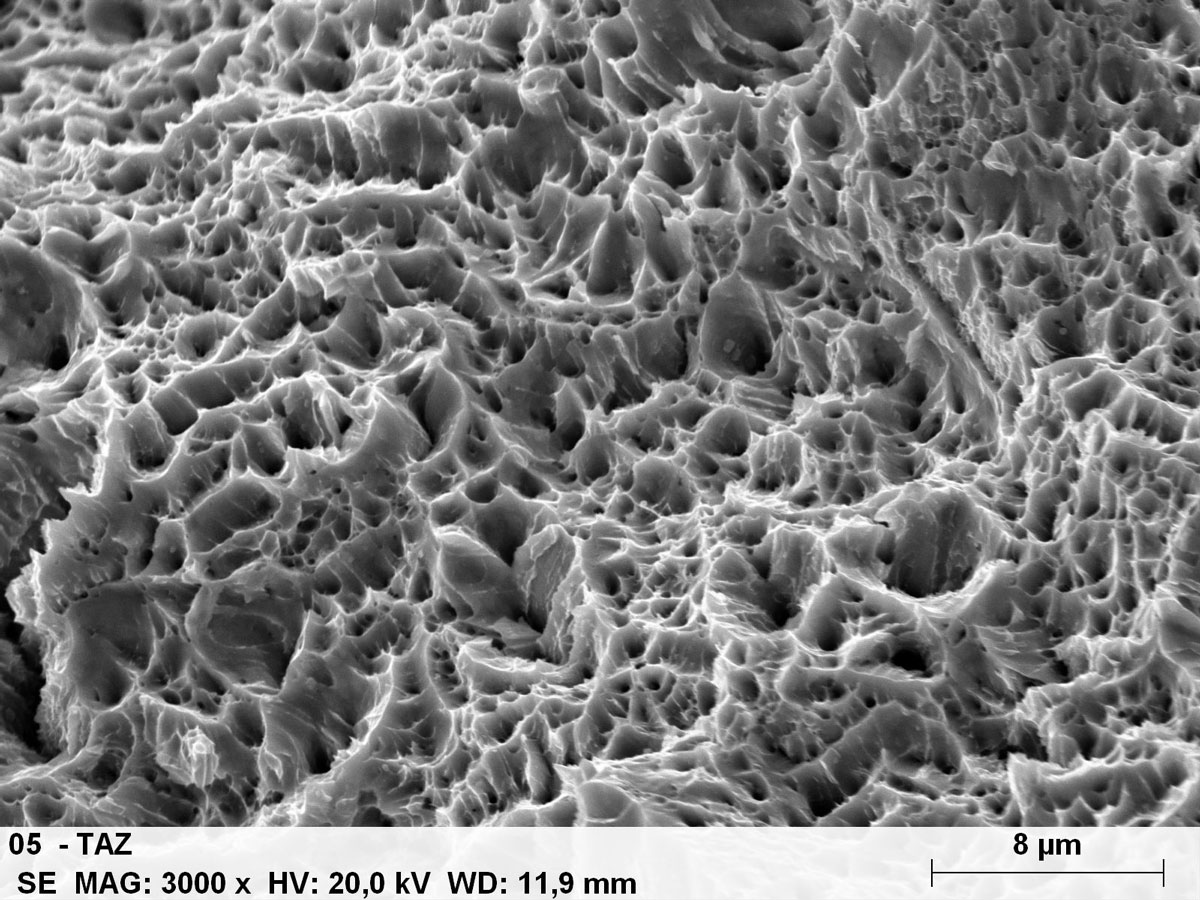
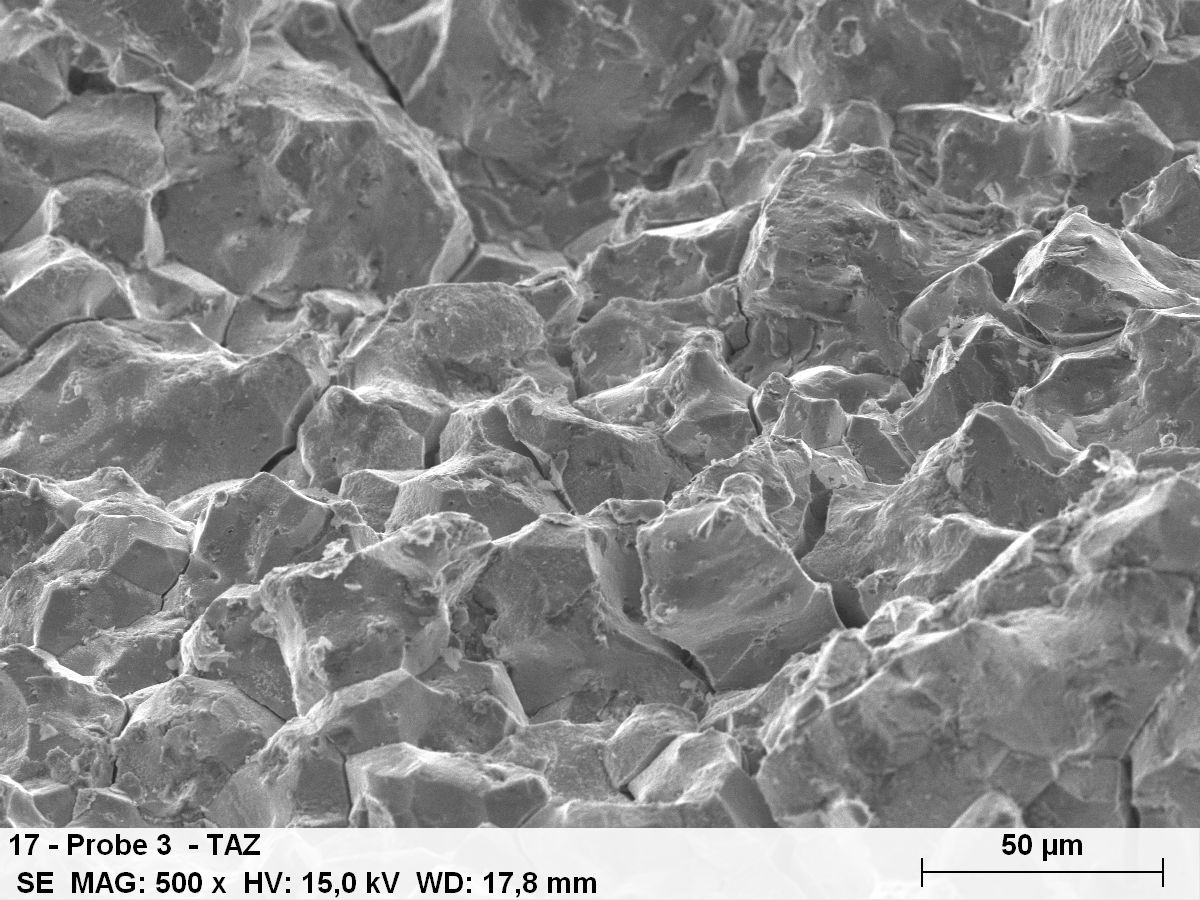
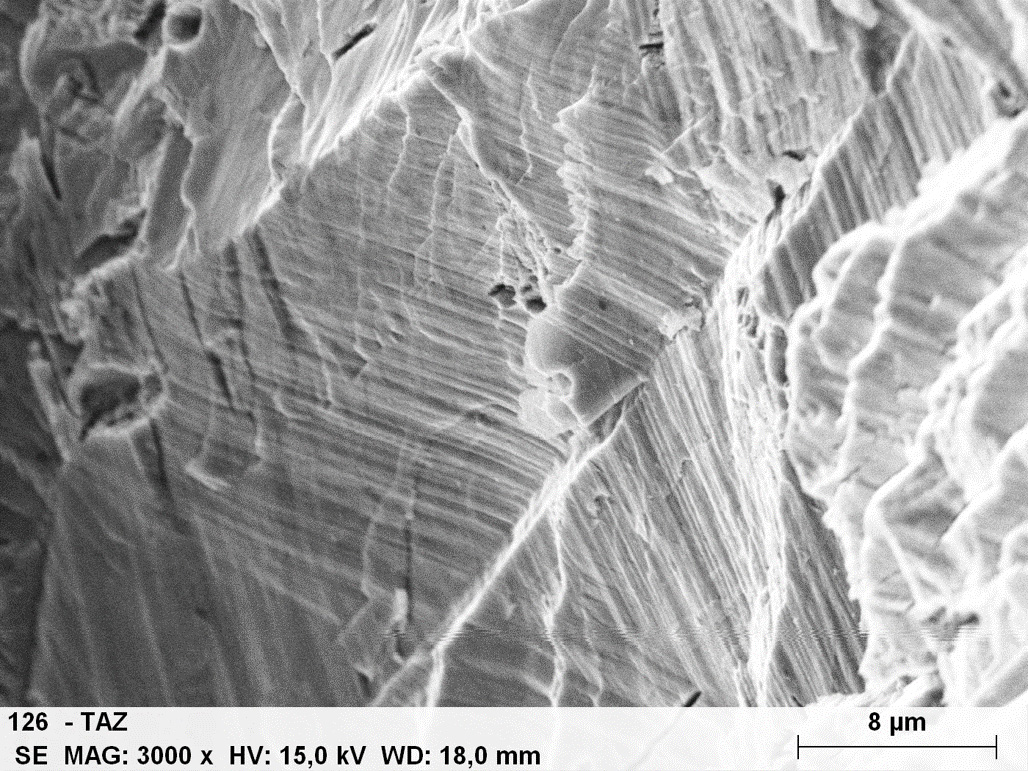
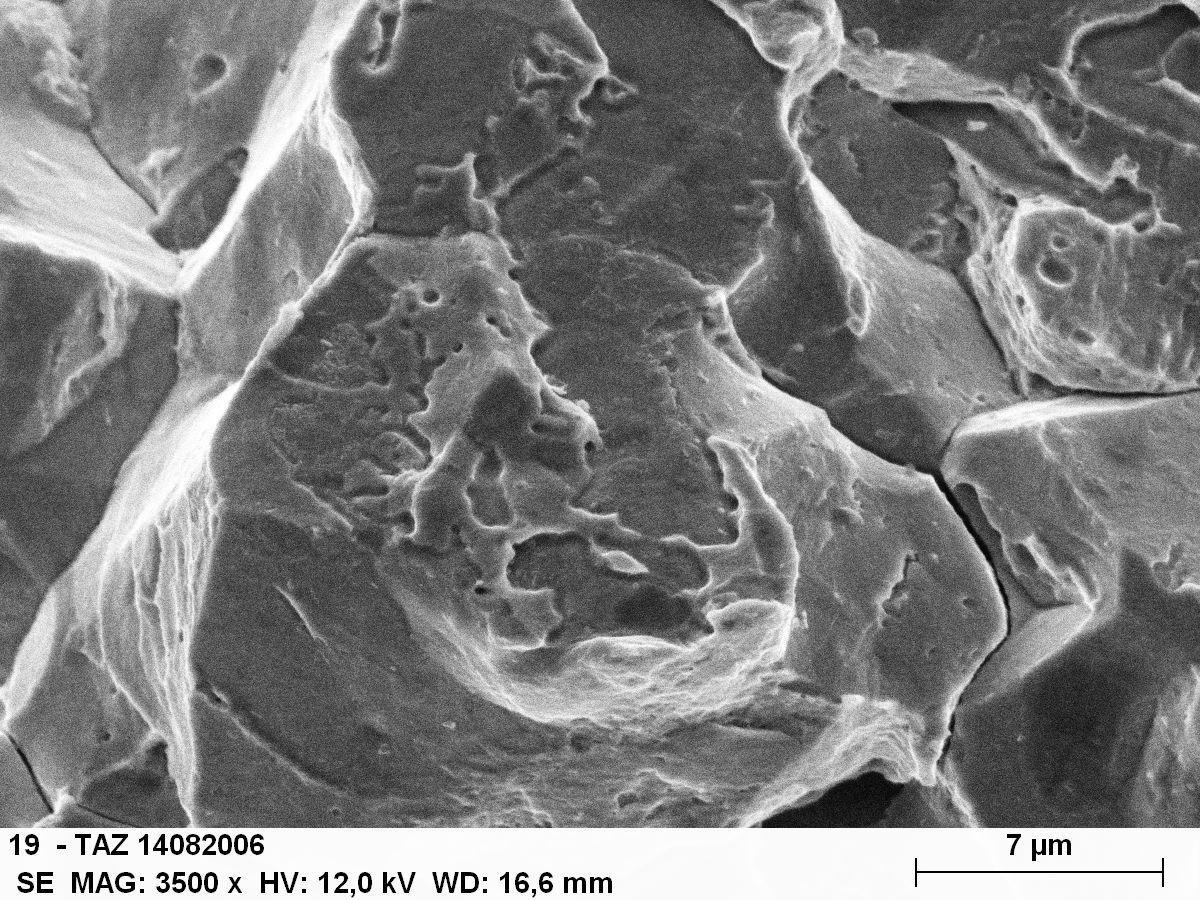
B – Classification according to fracture mechanism
Shear fracture (honeycomb fracture)

Cleavage fracture
Fracture due to cracking corrosion
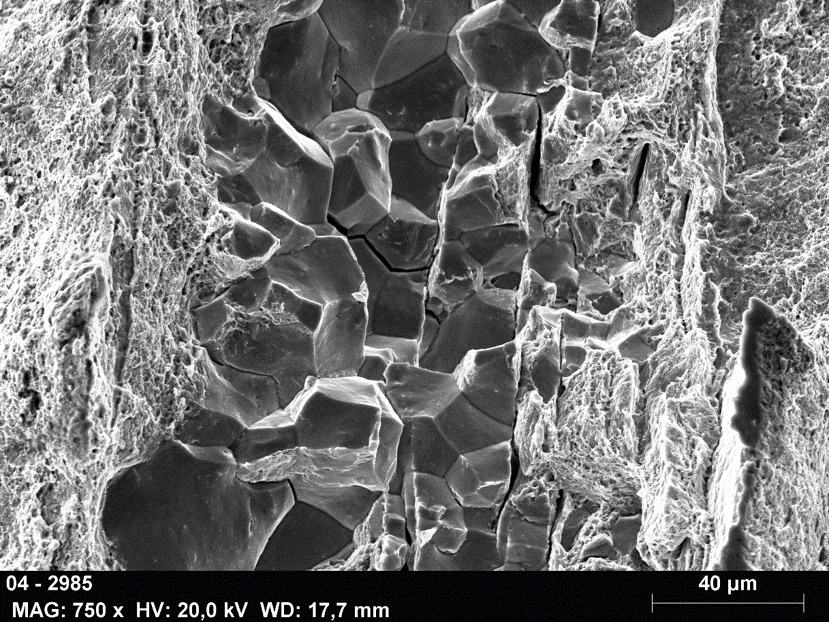
C – Classification into 3 main groups: cracks and fractures
Due to mechanical stress


Due to thermal stress
Due to corrosion
Elemental distribution images of cast flake graphite with local enrichments of phosphorus, chromium and molybdenum


EDX is a method for spatially resolved elemental analysis of solids. Energy dispersive X-ray microanalysis enables the determination of the elemental composition on a surface imaged by SEM. In addition to area and spot measurements, element distribution mappings can also be recorded. These enable a local assignment of the element distribution over a specific measuring range.